Throughout the last couple of months, we at the stormglass.io team have worked intensively with improving the tide part of our API. We’ve analyzed reports submitted by our users, developed internal quality assurance tooling and taken a deep dive into technical papers regarding the prediction of tides.
During our efforts, we’ve identified a number of areas where we could increase both coverage and quality. We’ve taken action and are extremely pleased to announce that we’ve made some significant improvements resulting in a tide prediction system that is better than ever!
With this article, we want to encourage you to explore our tide prediction API if you haven’t already done so. It’s free to sign up and free to use for as long as you like.
Astronomical and meteorological tide
When it comes to tide prediction, it is often useful to understand the distinction between astronomical and meteorological tide. Astronomical tide is caused by the relative movement of the celestial bodies which are highly periodic, making astronomical tide highly predictable.
Metrological tide on the other hand is caused by the erratic and sometimes chaotic behavior of different meteorological phenomena, such as atmospheric pressure, making it inherently less predictable. Being chaotic by nature, metrological tide will manifest itself as noise to the otherwise smoothly-varying astronomical tide. Thankfully, its effect is often small when compared to the effect of astronomical tide.
The effect that tide has on the sea level varies greatly depending on the location observed. Some parts of the world experience tidal ranges of up to 18 meters/59 feet (!) while other parts experience virtually no difference in sea level at all. Why is that? The seas, oceans, bays, rivers and creeks are all connected. Wouldn’t it make sense if they all were affected?
The answer is that they are, but that the energies carried by the tidal waves dissipate differently depending on the hydrodynamics along the path of which the tidal wave travels. The regions most affected by tidal variations are located in locations where the shape of the seabed amplifies the tidal wave. The same is true for regions experiencing virtually no tide at all with the difference being that the seabed dampens the tidal wave instead of amplifying it.
The stormglass.io tide API
Most parts of our API are accessed by querying a specific coordinate and the tide part of our API is no different. You provide it with coordinates and it’ll provide you with the corresponding data. However, there’s a slight twist when it comes to the tide part.
Astronomical tide is predicted through analyzing long series of observational data. The data is collected at distinct locations, known as stations, usually installed where the tidal variations are of particularly high interest. Inlets, harbors, piers and buoys are often fitted with different types of sensors for observing how the sea level varies over time.
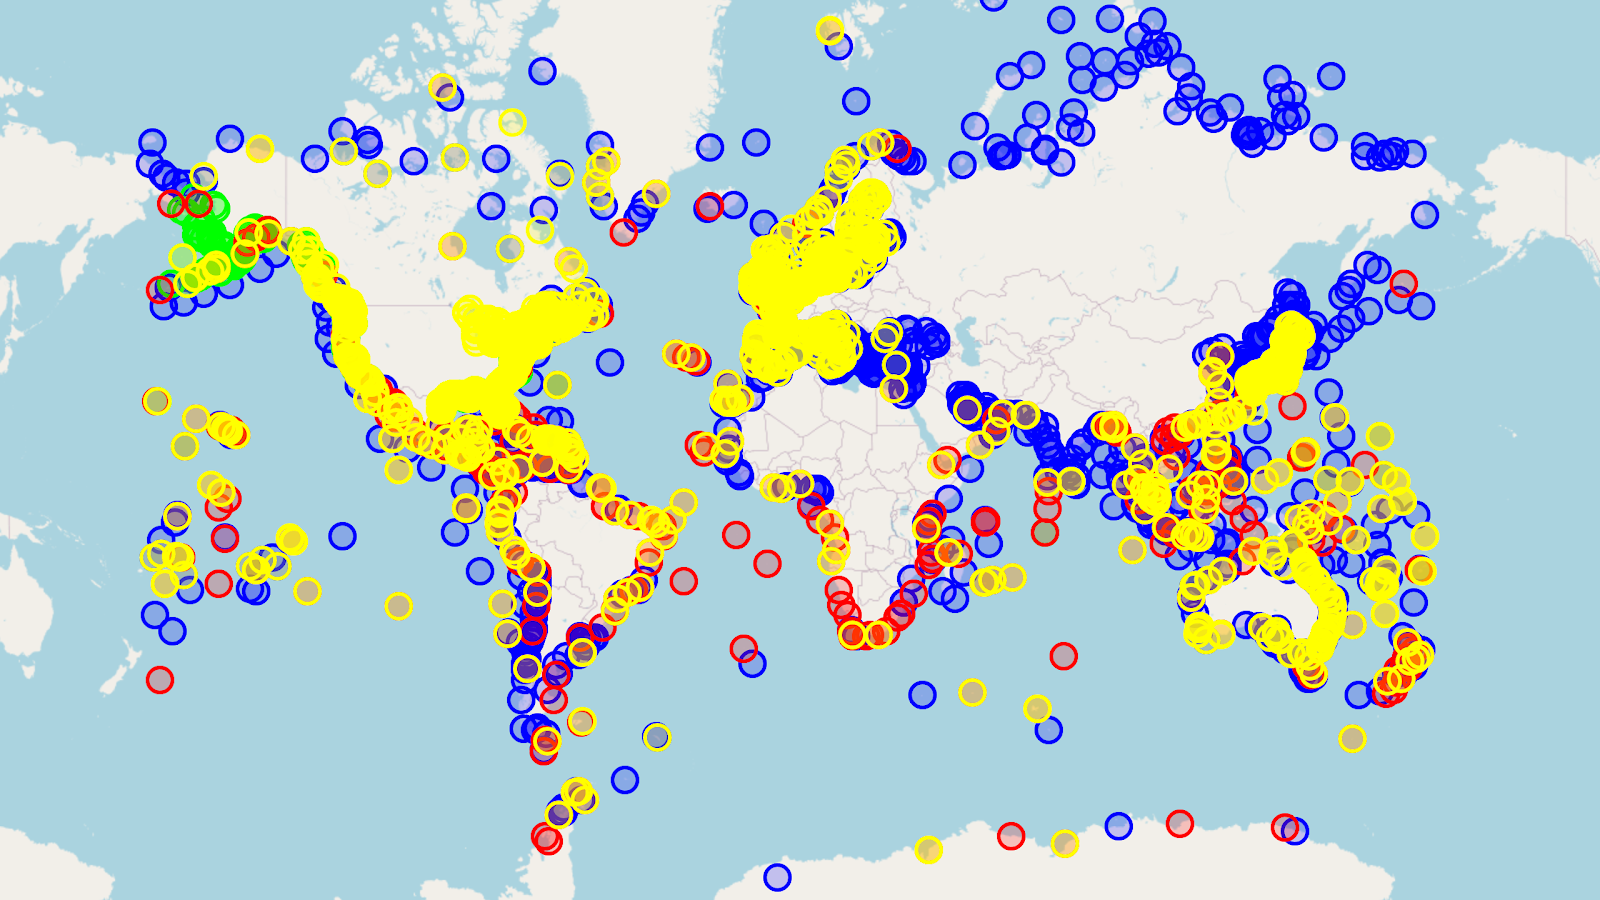
The stormglass.io tide API contains thousands of stations, located all around the world, but don’t let that intimidate you. Our API automatically and transparently selects the station closest to the coordinates you provide it with. All you have to worry about are the latitude and longitude coordinates. The stormglass.io API takes care of the rest.
Here is a screenshot from one of our internal tools displaying the locations of all our tide stations. The tool is used in our quality assurance work to give us an overview of the tide system as well as detailed information about each and every station.
Retrieving sea level time series data
The tide part of the stormglass.io API mainly consists of two different API endpoints, the sea-level endpoint and the extremes endpoint. Let’s start this deep dive into the tide API by looking at the sea-level endpoint as it will give us a good understanding of the system and some of the terminology associated with tidal predictions.
Specifying latitude and longitude coordinates
Start by selecting the latitude and longitude coordinates for the location at which you wish to predict the sea levels. For instance, the coordinates for Seattle, WA is 47.6061° N, 122.3328° W according to Google. These coordinates are specified by sending a GET request to the sea-level endpoint through the https://api.stormglass.io/v2/tide/sea-level/point?lat=47.6061&lng=-122.3328 URL. Notice that the longitude coordinate is specified using a negative sign as it is located west of the prime meridian. Latitudes south of the equator would be specified using a negative sign in the same fashion.
Our API responds with two distinct parts, the data part containing a series of predicted relative sea levels and the meta part containing metadata for the request in question. The data part will contain predictions for each hour of the upcoming 10 days by default which is similar to how other parts of our API works. The date range is easily specified as part of the request URL, specifically through the addition of the start and end parameters.
Dealing with timezones and local dates
The stormglass.io API is a global weather API which requires it to use standardized formats and units. When it comes to defining specific points or ranges in time, the stormglass.io API always uses the UTC time zone. This is true for request parameters as well as for response data. It is crucial to fully understand this in certain situations such as when requesting API data for a local date.
To get the predicted sea levels for Seattle, WA for the local date 2024-01-01 we first have to adjust the local date into the corresponding UTC time range. We do this by subtracting the time difference compared to UTC from the start and end parameters. Seattle, WA is 8 hours behind UTC for the local date in question which means that we should subtract negative 8 hours (i.e. add 8 hours). The start and end parameters become 2024-01-01T08 and 2024-01-02T08, respectively.
The times included in the response will be UTC and are to be adjusted by adding the time difference compared to UTC. Adding negative 8 hours (i.e. subtracting 8 hours) converts the UTC times into the local time zone.
Sending a GET request to the https://api.stormglass.io/v2/tide/sea-level/point?lat=47.6061&lng=-122.3328&start=2024-01-01T08&end=2024-01-02T08 URL gives us the following response:
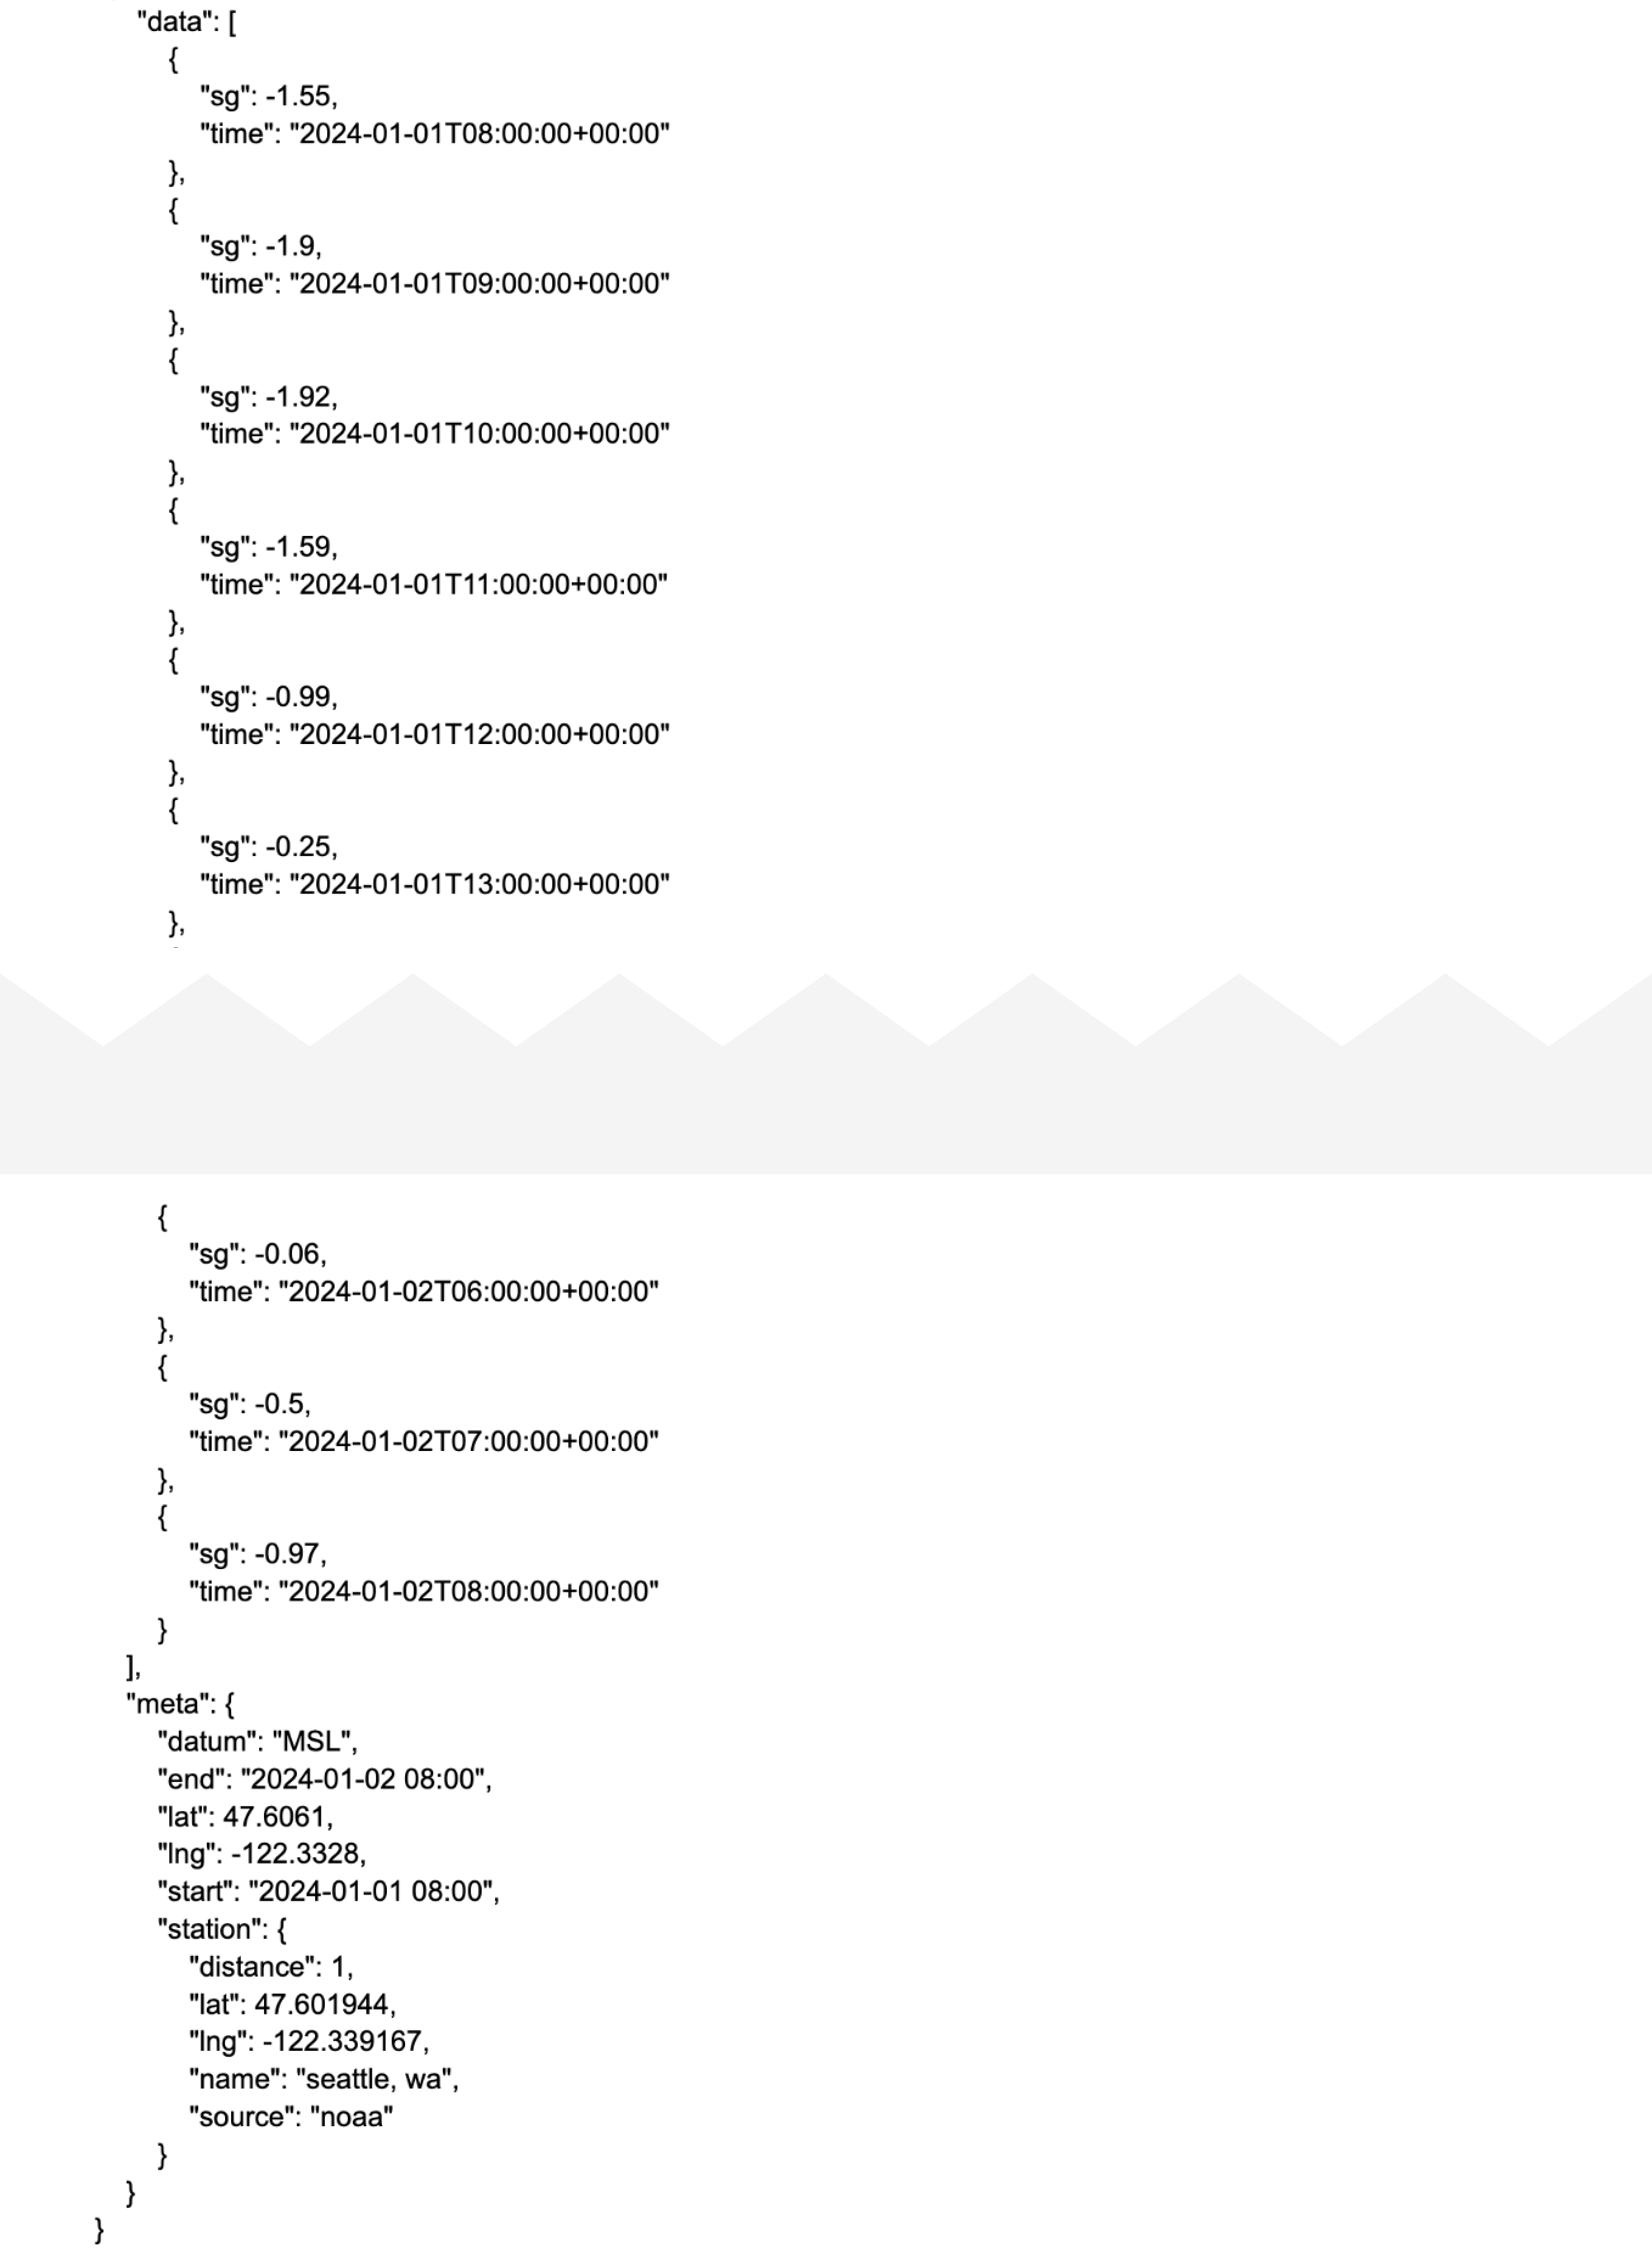
The metadata section will give us information about the closest station given the requested coordinates through the station object. By looking at the distance property, we can tell that the station was located in close proximity to the requested coordinates at a distance of only 1 km. We also get information about the station operator which in this case is the National Oceanic and Atmospheric Administration who are one of several data providers for the tide part of our API.
Datums and relative sea levels
We mentioned that the data part of the response contains relative sea level predictions. It is important to know what these values are in relation to. Simply put, the predictions are relative to the requested reference level, or datum. The metadata section provides us this information through the datum property. We can see that it is MSL, or Mean Sea Level, for the above request. The MSL datum is often a good choice, which is why we’ve configured it as the default datum in the stormglass.io API. When using it, the relative sea levels returned in the responses should be interpreted as the deviation from the average sea level.
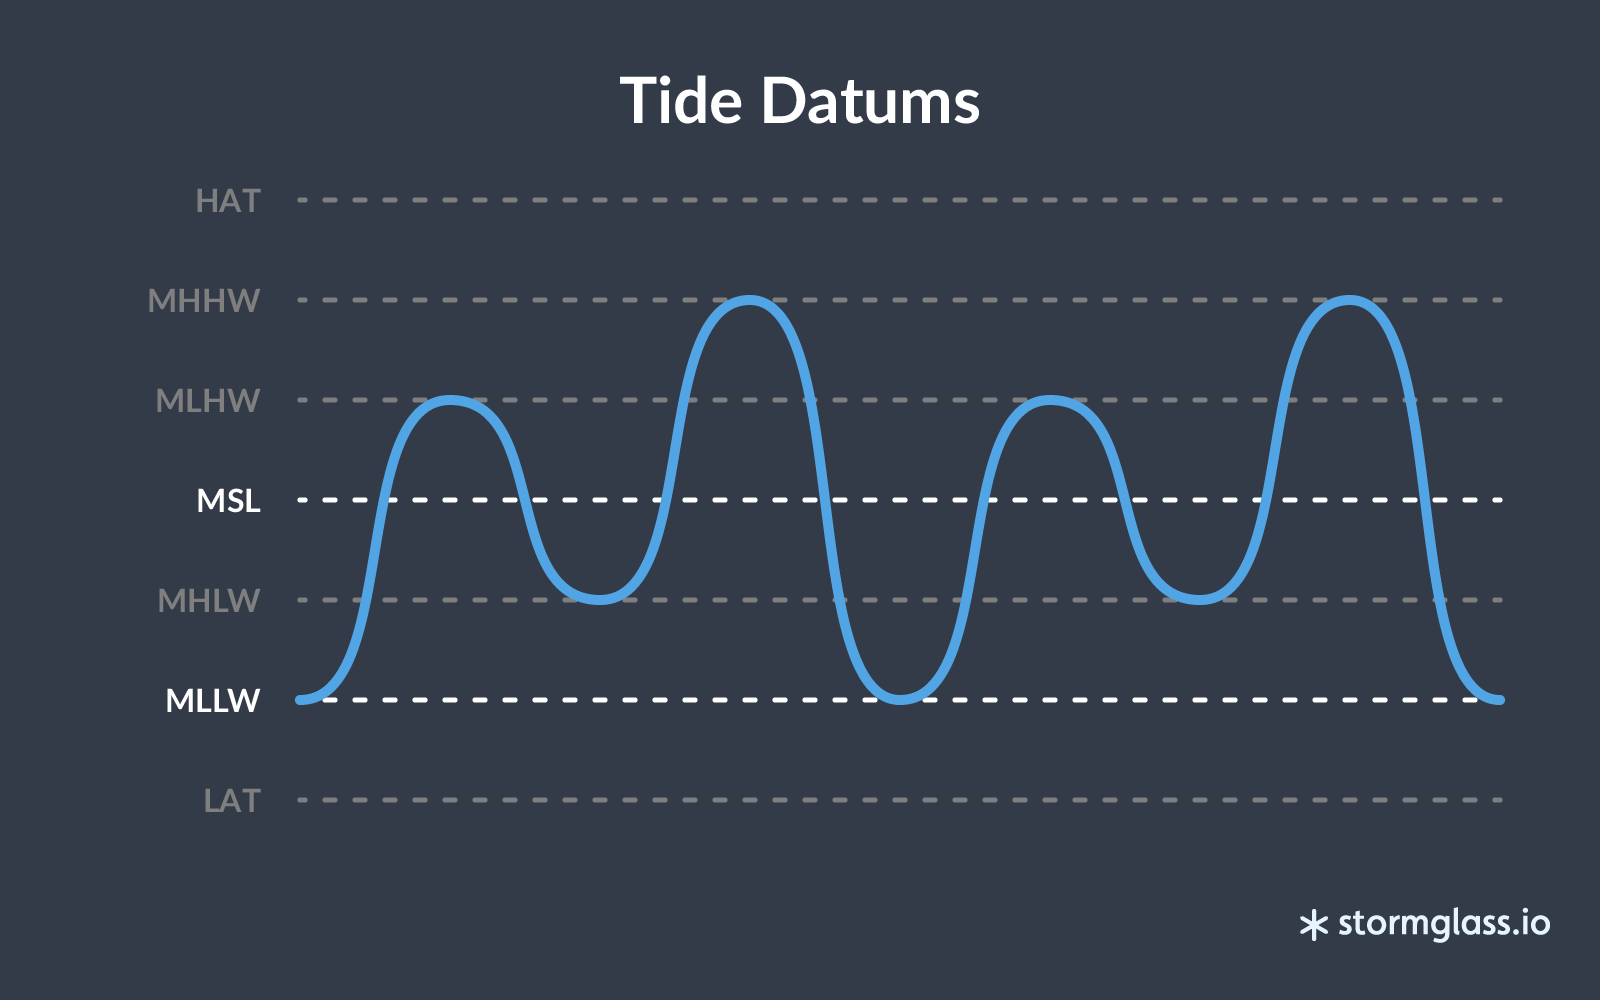
In some instances, it is more useful to adjust the data in a way that allows one to quickly determine the amount by which the sea level has risen from its average low level. For those instances we support the MLLW, or Mean Lower Low Water, datum. The desired datum is easily specified through the datum parameter which the stormglass.io API reads and uses to automatically adjust all values for you.
The common reference levels, or datums, for tide. The datums supported by the stormglass.io API are MSL and MLLW.
Sending a GET request to the https://api.stormglass.io/v2/tide/sea-level/point?lat=47.6061&lng=-122.3328&start=2024-01-01T08&end=2024-01-02T08&datum=MLLW URL gives us the following response:
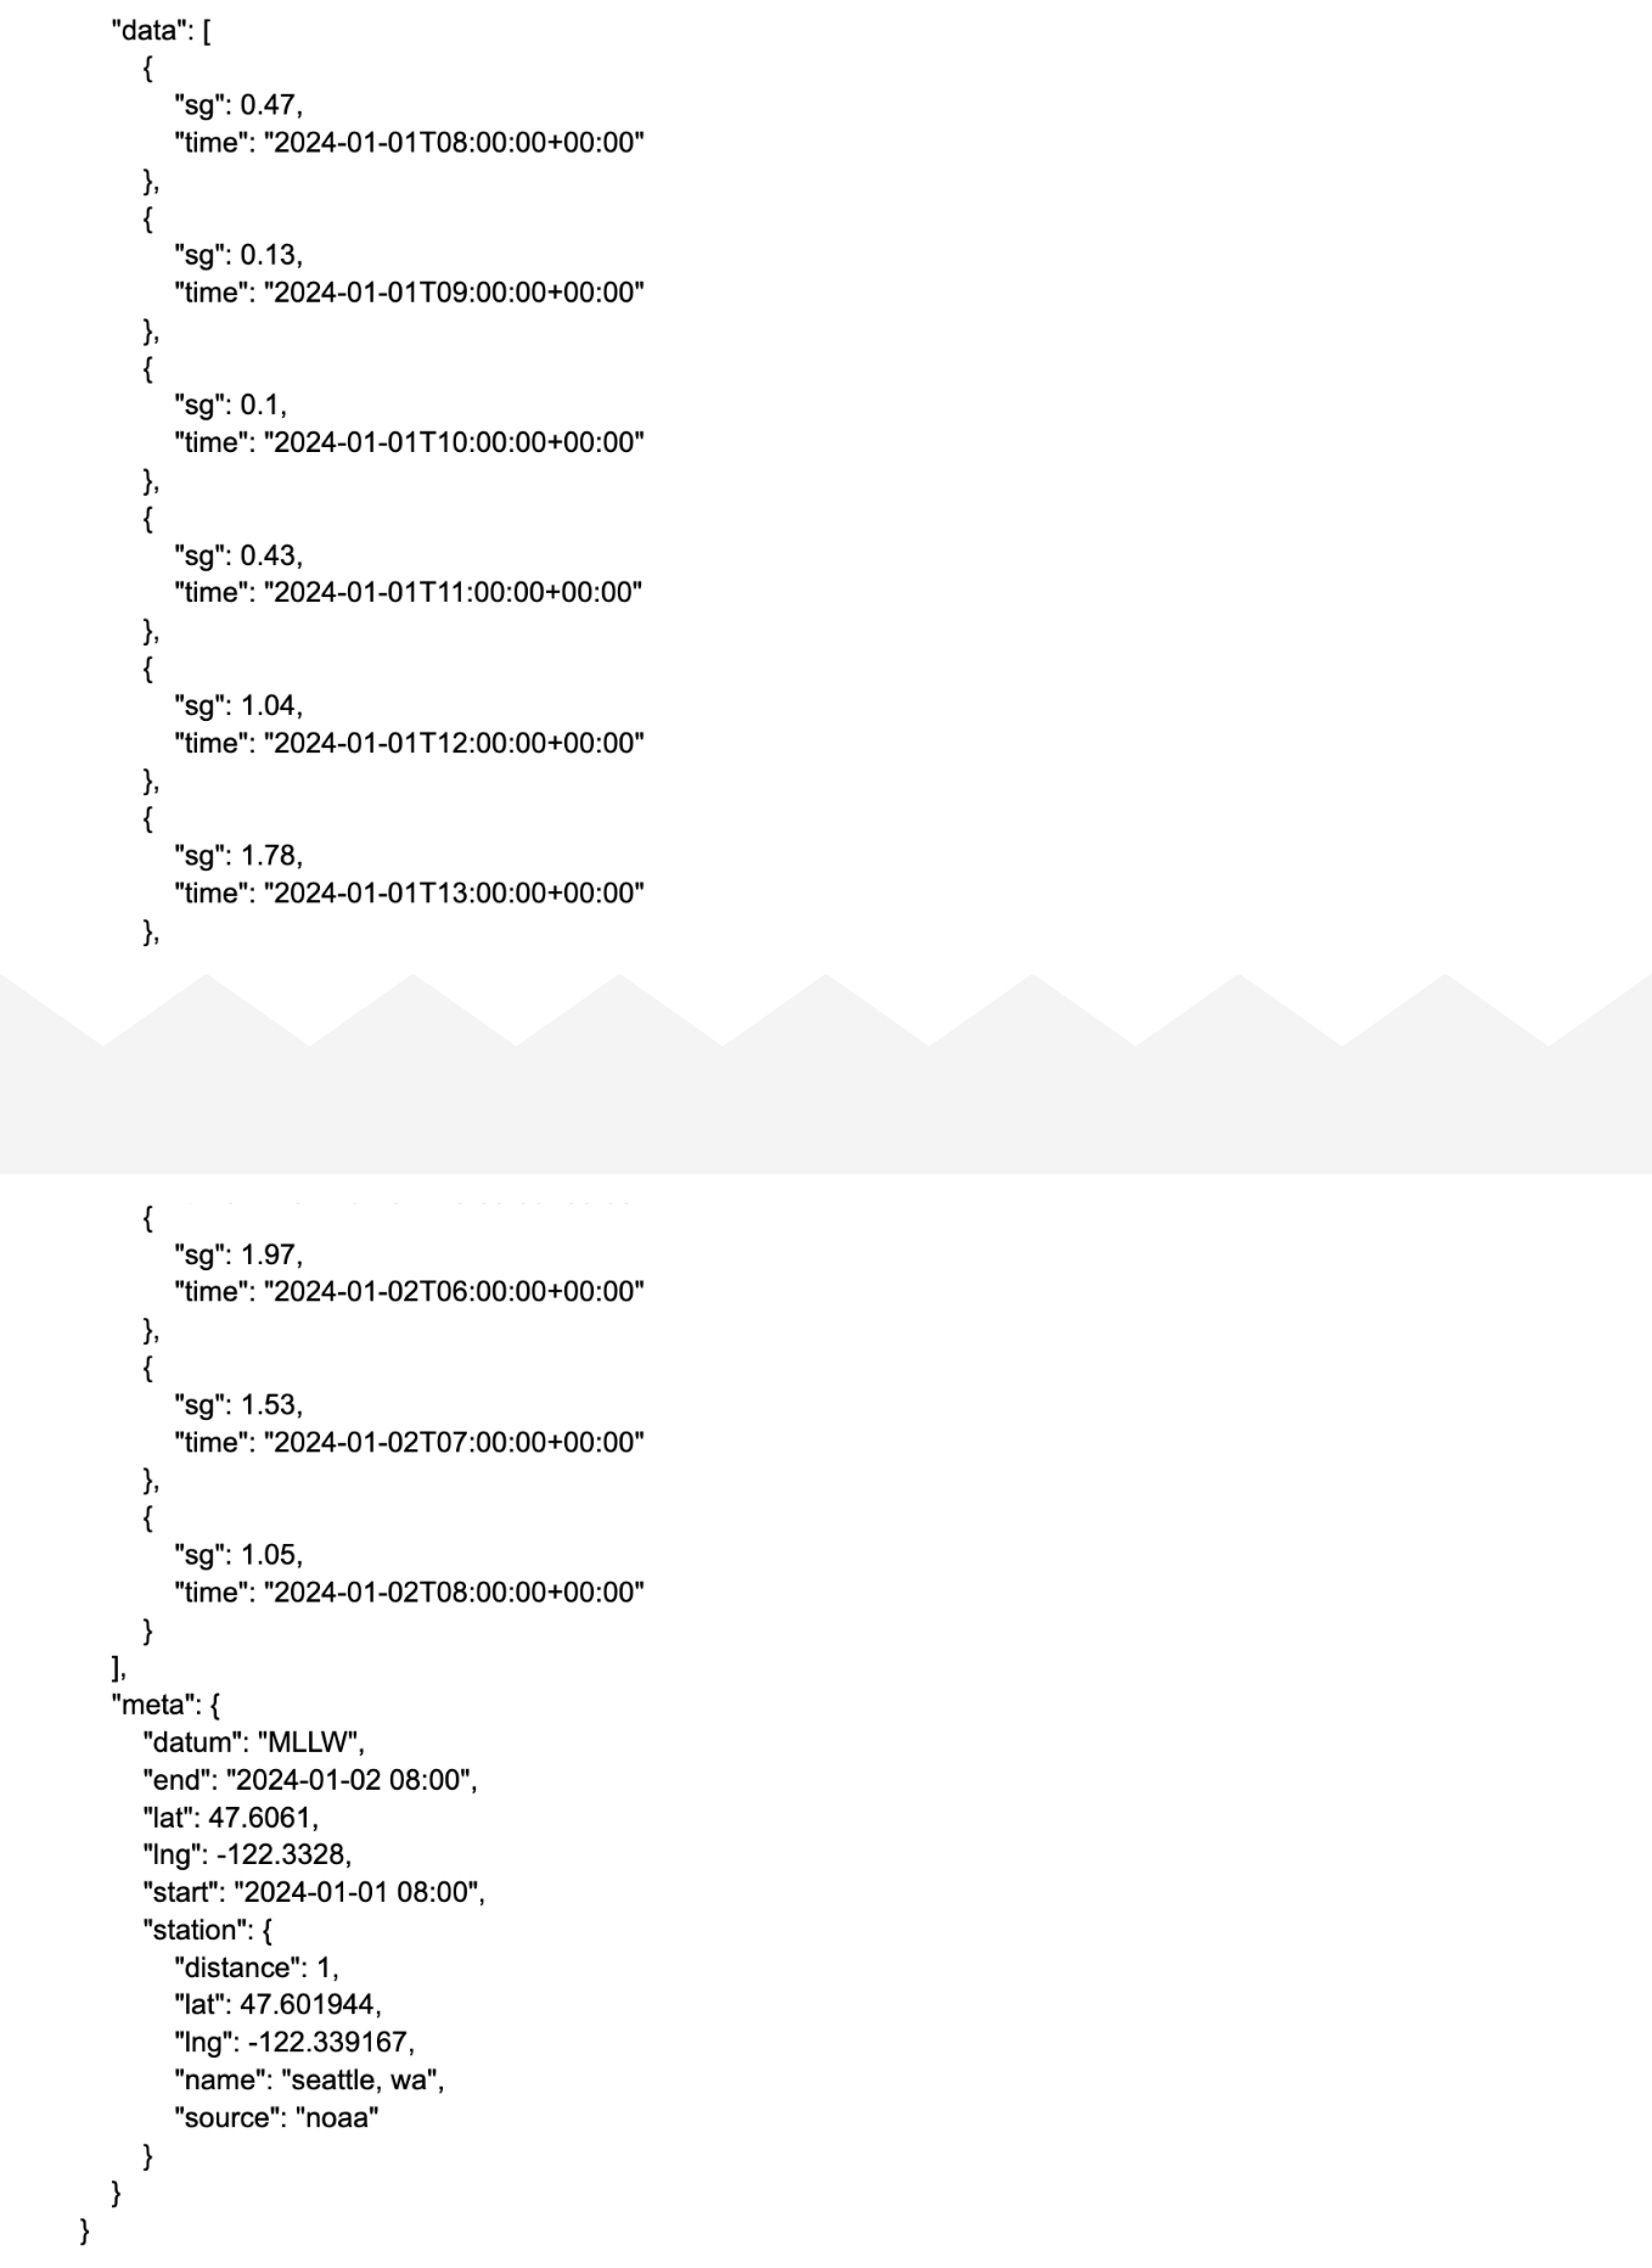
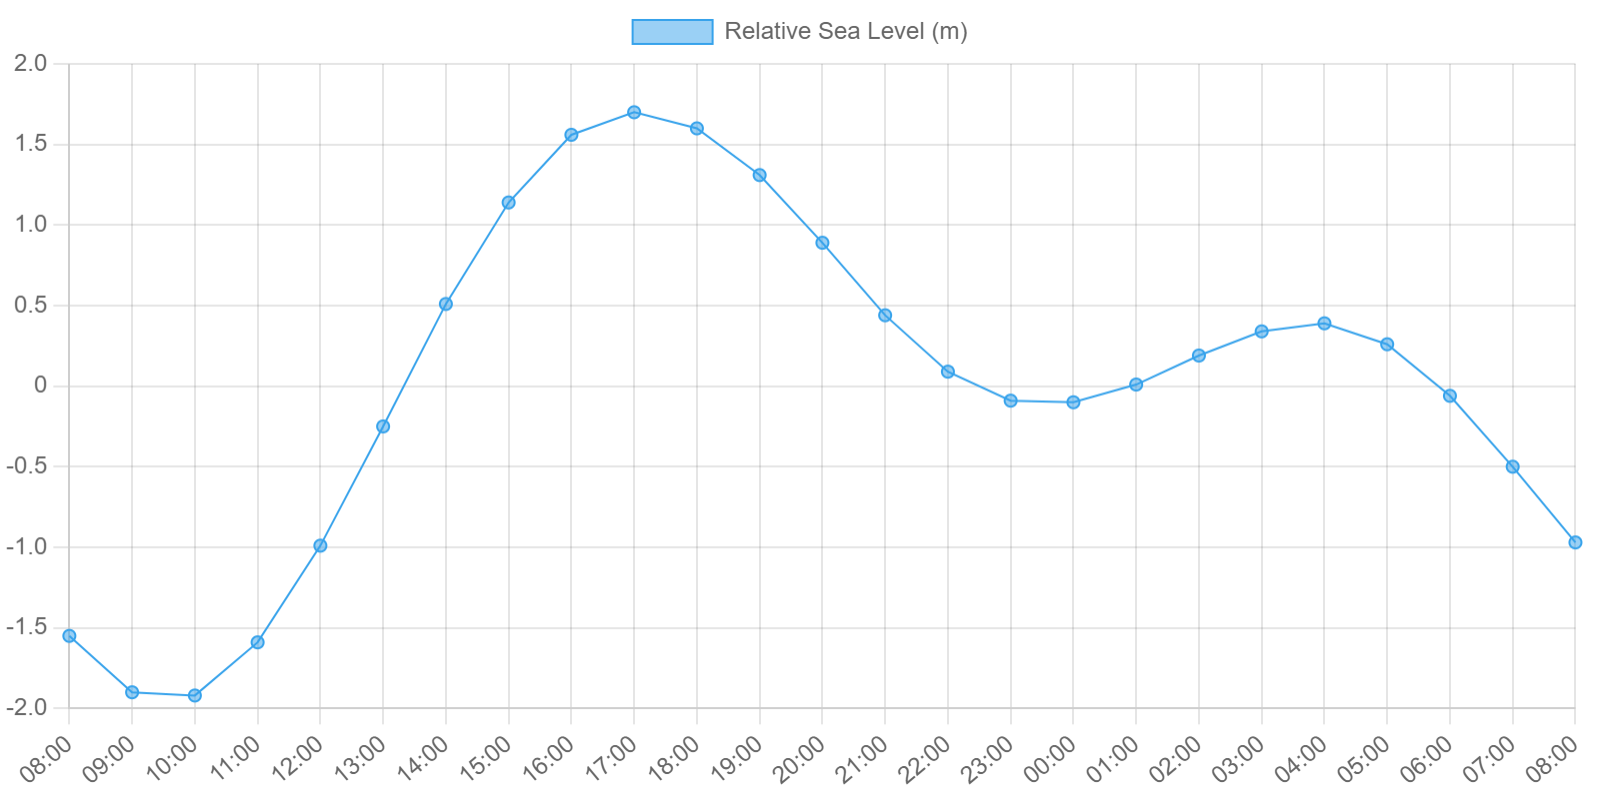
The difference between this response and the response from the request made earlier is best illustrated through plotting the data for the two responses.
The predicted sea levels for Seattle, WA for the local date 2024-01-01 expressed relative to the MSL datum. Times are UTC.
The predicted sea levels for Seattle, WA for the local date 2024-01-01 expressed relative to the MLLW datum. Times are UTC.
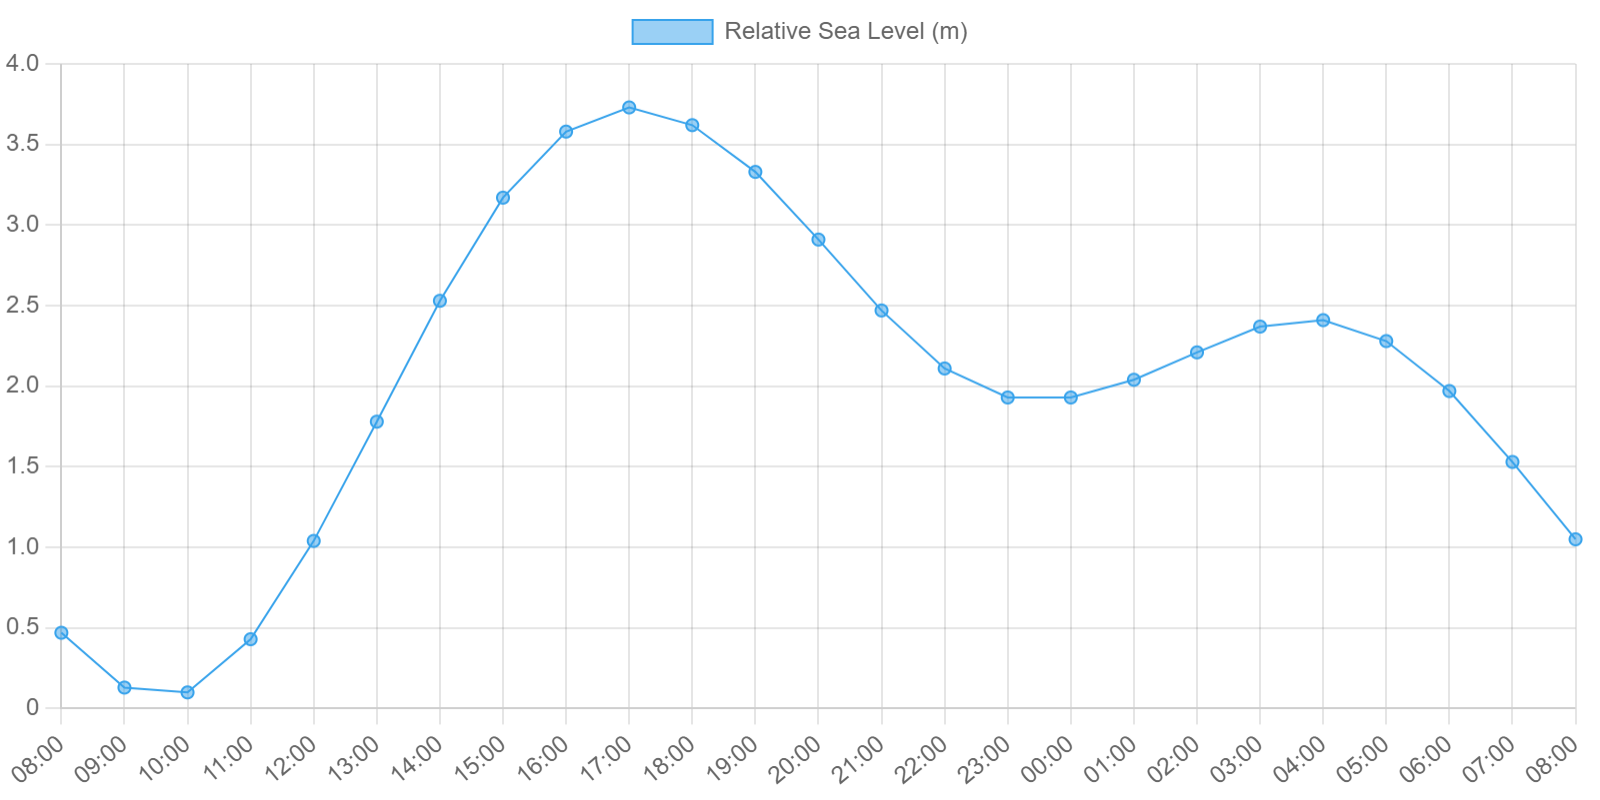
The stormglass.io API implements support for the two datums by adjusting the zero-level of the data returned in the requests to match the specified datum. This is clearly visible on the two graphs which display identical data with the only difference being the position of the zero level on the Y-axis.
Retrieving the high and low tide times
The times at which the tides turn are interesting for a number of different reasons. A low tide may connect two land masses making them accessible to each other whereas a high tide may connect two bodies of water in a similar fashion. It’s hard to understate the importance of the shifting tides and the effect they have on the ability to travel, both by land and by sea.
Tidal patterns
The tidal variations are mostly caused by astronomical tide, as discussed earlier. As such, they mostly depend on the position of the moon relative to the location observed. They also depend on the position of the sun, but to a lesser extent.
The moon takes about 24 hours and 50 minutes to complete a revolution around the earth. This is the main factor that determines the periodicity of tidal variations and also causes the tide times to successively shift forward every day.
Different parts of the world experience different types of tide depending on the hydrodynamics of the location in question. Some places experience tides that have one high tide and one low tide every 24 hours and 50 minutes. Such tides are known as diurnal tides. Other places experience tides that have one high tide and one low tide every 12 hours and 25 minutes which is known as semi-diurnal tides. There is also a mixture of them both known as mixed or mixed semi-diurnal for which the amplitudes of the highs and lows vary over the complete 24 hours and 50 minutes period. The mixed semi-diurnal pattern is very common.
The stormglass.io tide API provides convenient functionality for predicting the times at which the tides turn for a specific location. This functionality is available through the extremes endpoint which is accessed through sending a GET request to its URL.
The desired location is specified through a pair of latitude and longitude coordinates, just like all other data endpoints. We’ll be using Seattle, WA, located at coordinates 47.6061° N, 122.3328°, and the local date 2024-01-01 for this example as well.
The extremes endpoint is accessed through sending a GET request to the https://api.stormglass.io/v2/tide/extremes/point?lat=47.6061&lng=-122.3328&start=2024-01-01T08&end=2024-01-02T08 URL. The response for the request is as follows:
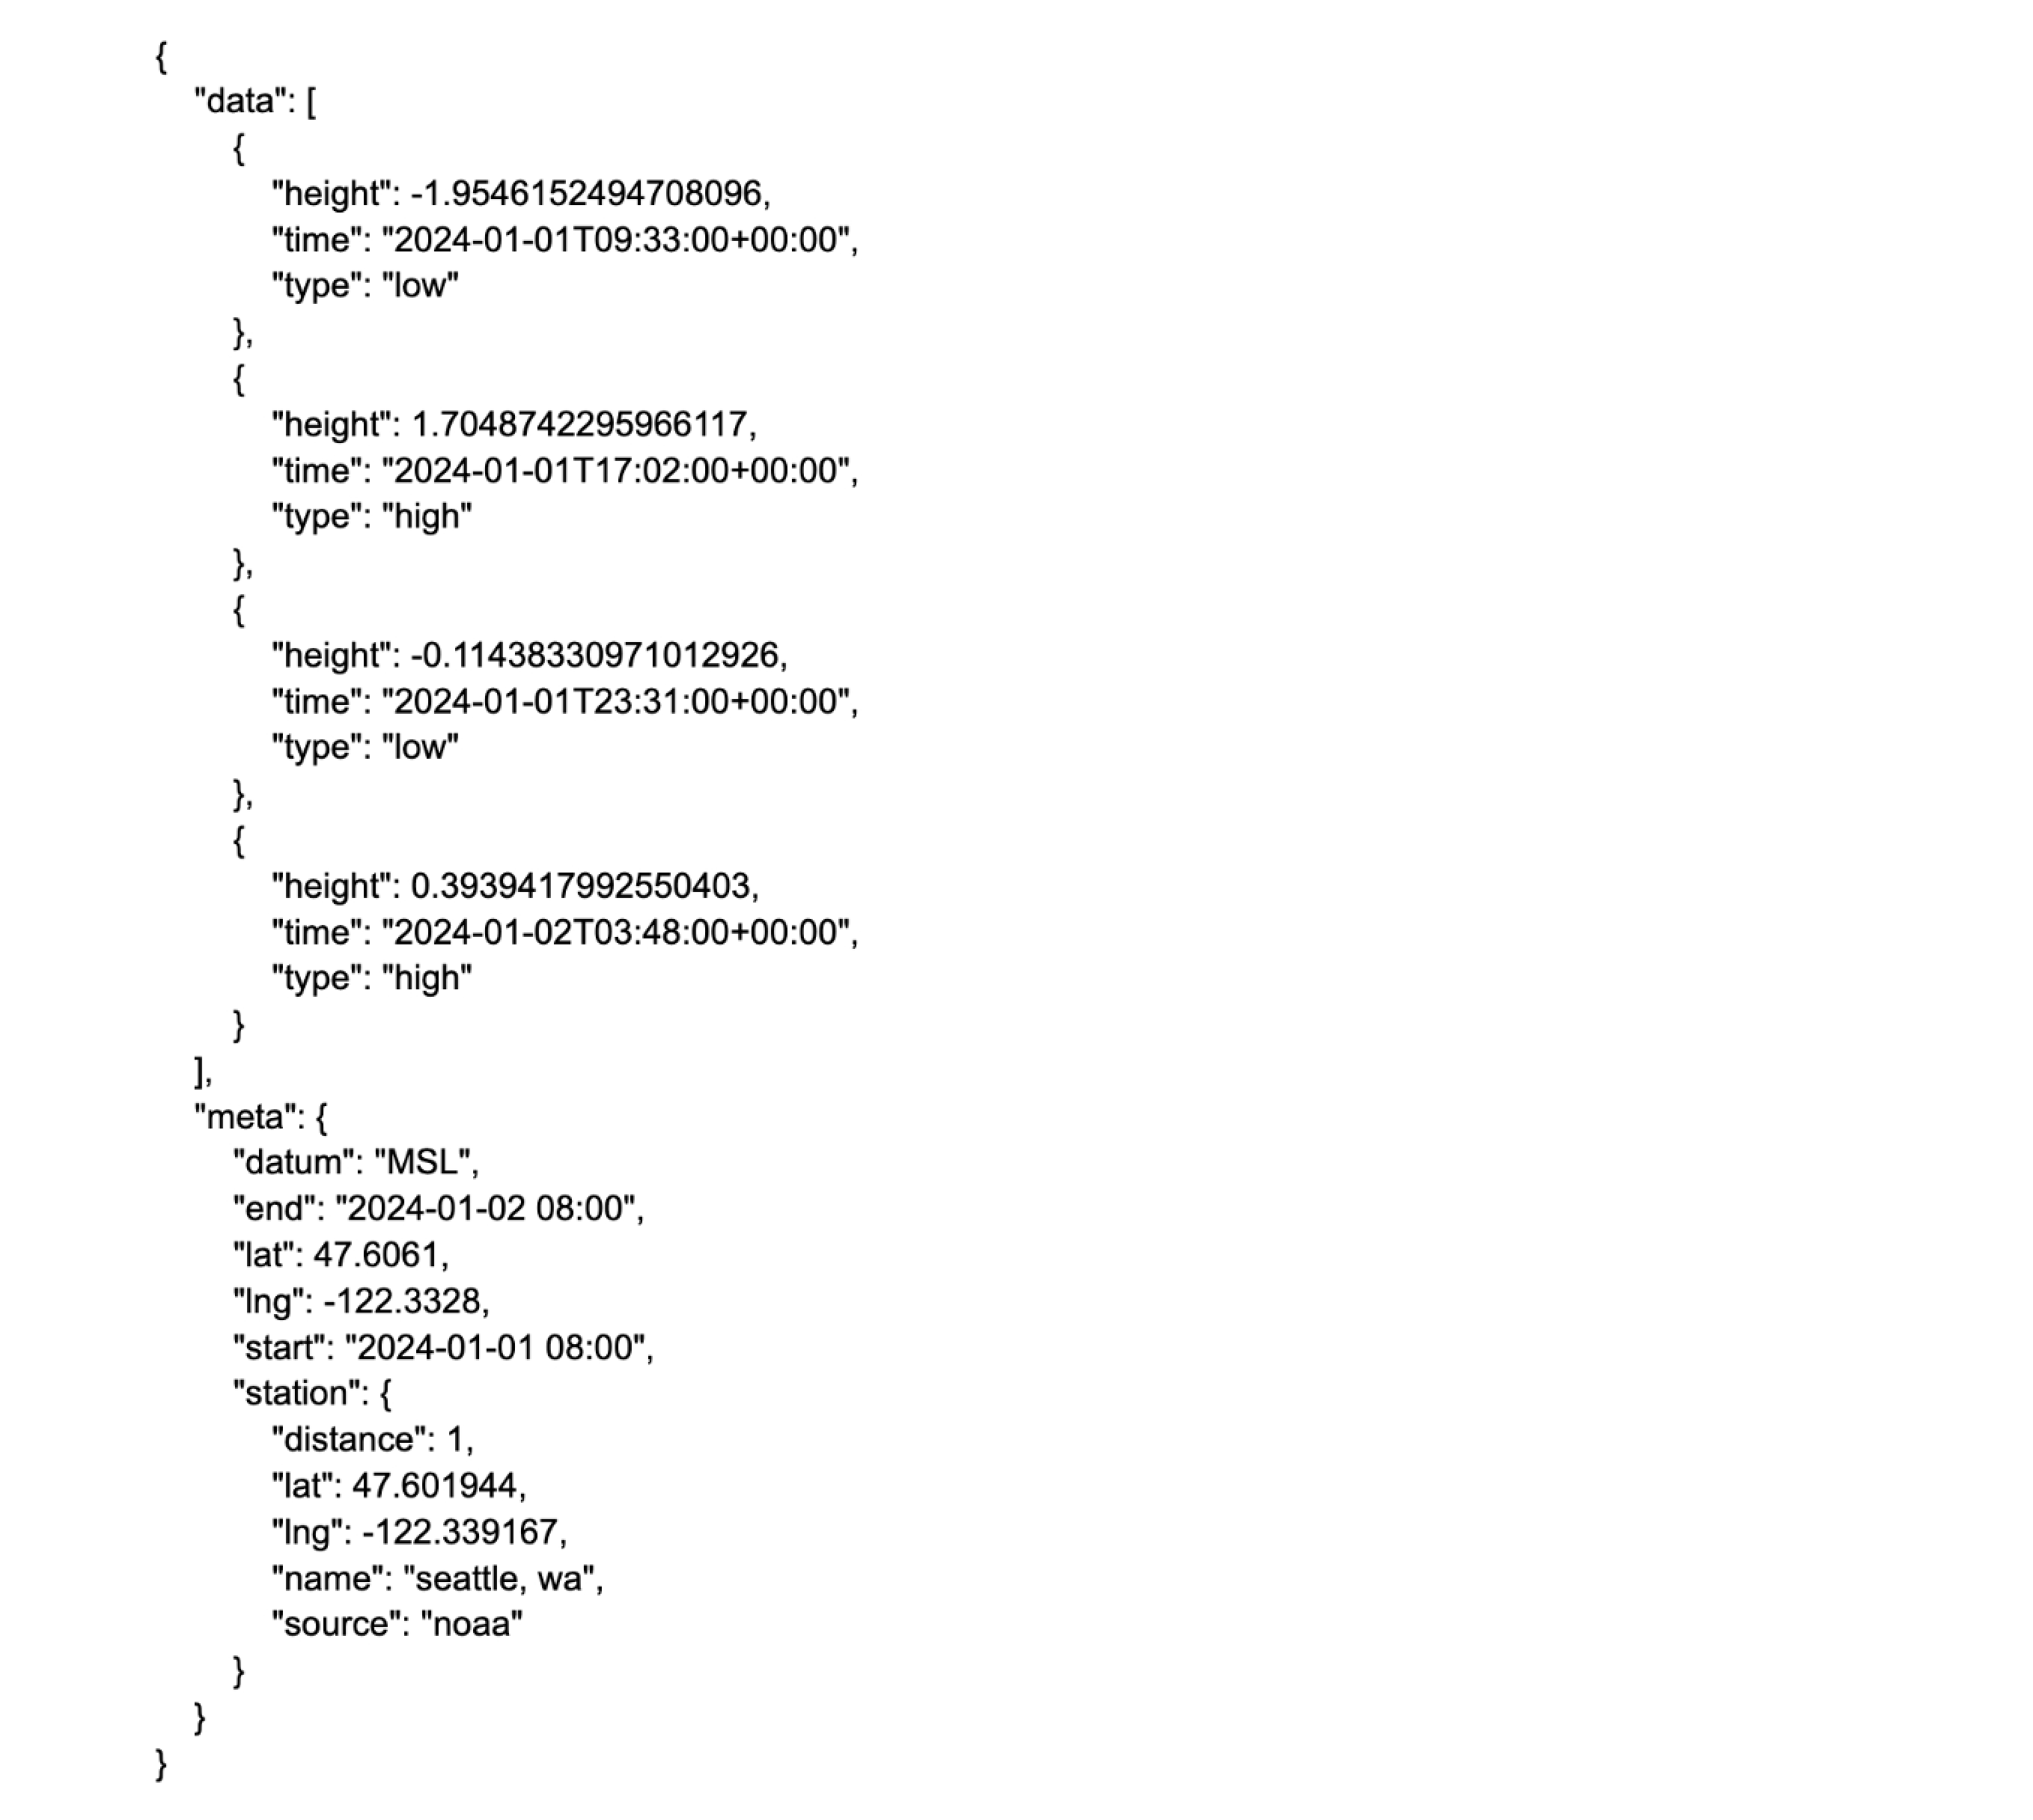
Just as for the sea-level endpoint, we can see that the response includes two distinct parts, the data part and the meta part. The metadata part is identical to the metadata part included in the response of the previous example since the same coordinates were used which in turn caused the stormglass.io API to select the same station. However, the data part is different.
When requesting the extremes endpoint, the data part will contain all the times at which the tides turn. The times are coupled with information about the type of extreme (high or low) as well as the corresponding sea level expressed relative to the datum. The datum may be specified through the datum parameter in the same way as for the sea-level route.
Sending a GET request to the https://api.stormglass.io/v2/tide/extremes/point?lat=47.6061&lng=-122.3328&start=2024-01-01T08&end=2024-01-02T08&datum=MLLW URL gives us a response similar to the previous example for the sea level request. In the responses, only the height values differ. The times at which the tides turn are identical.
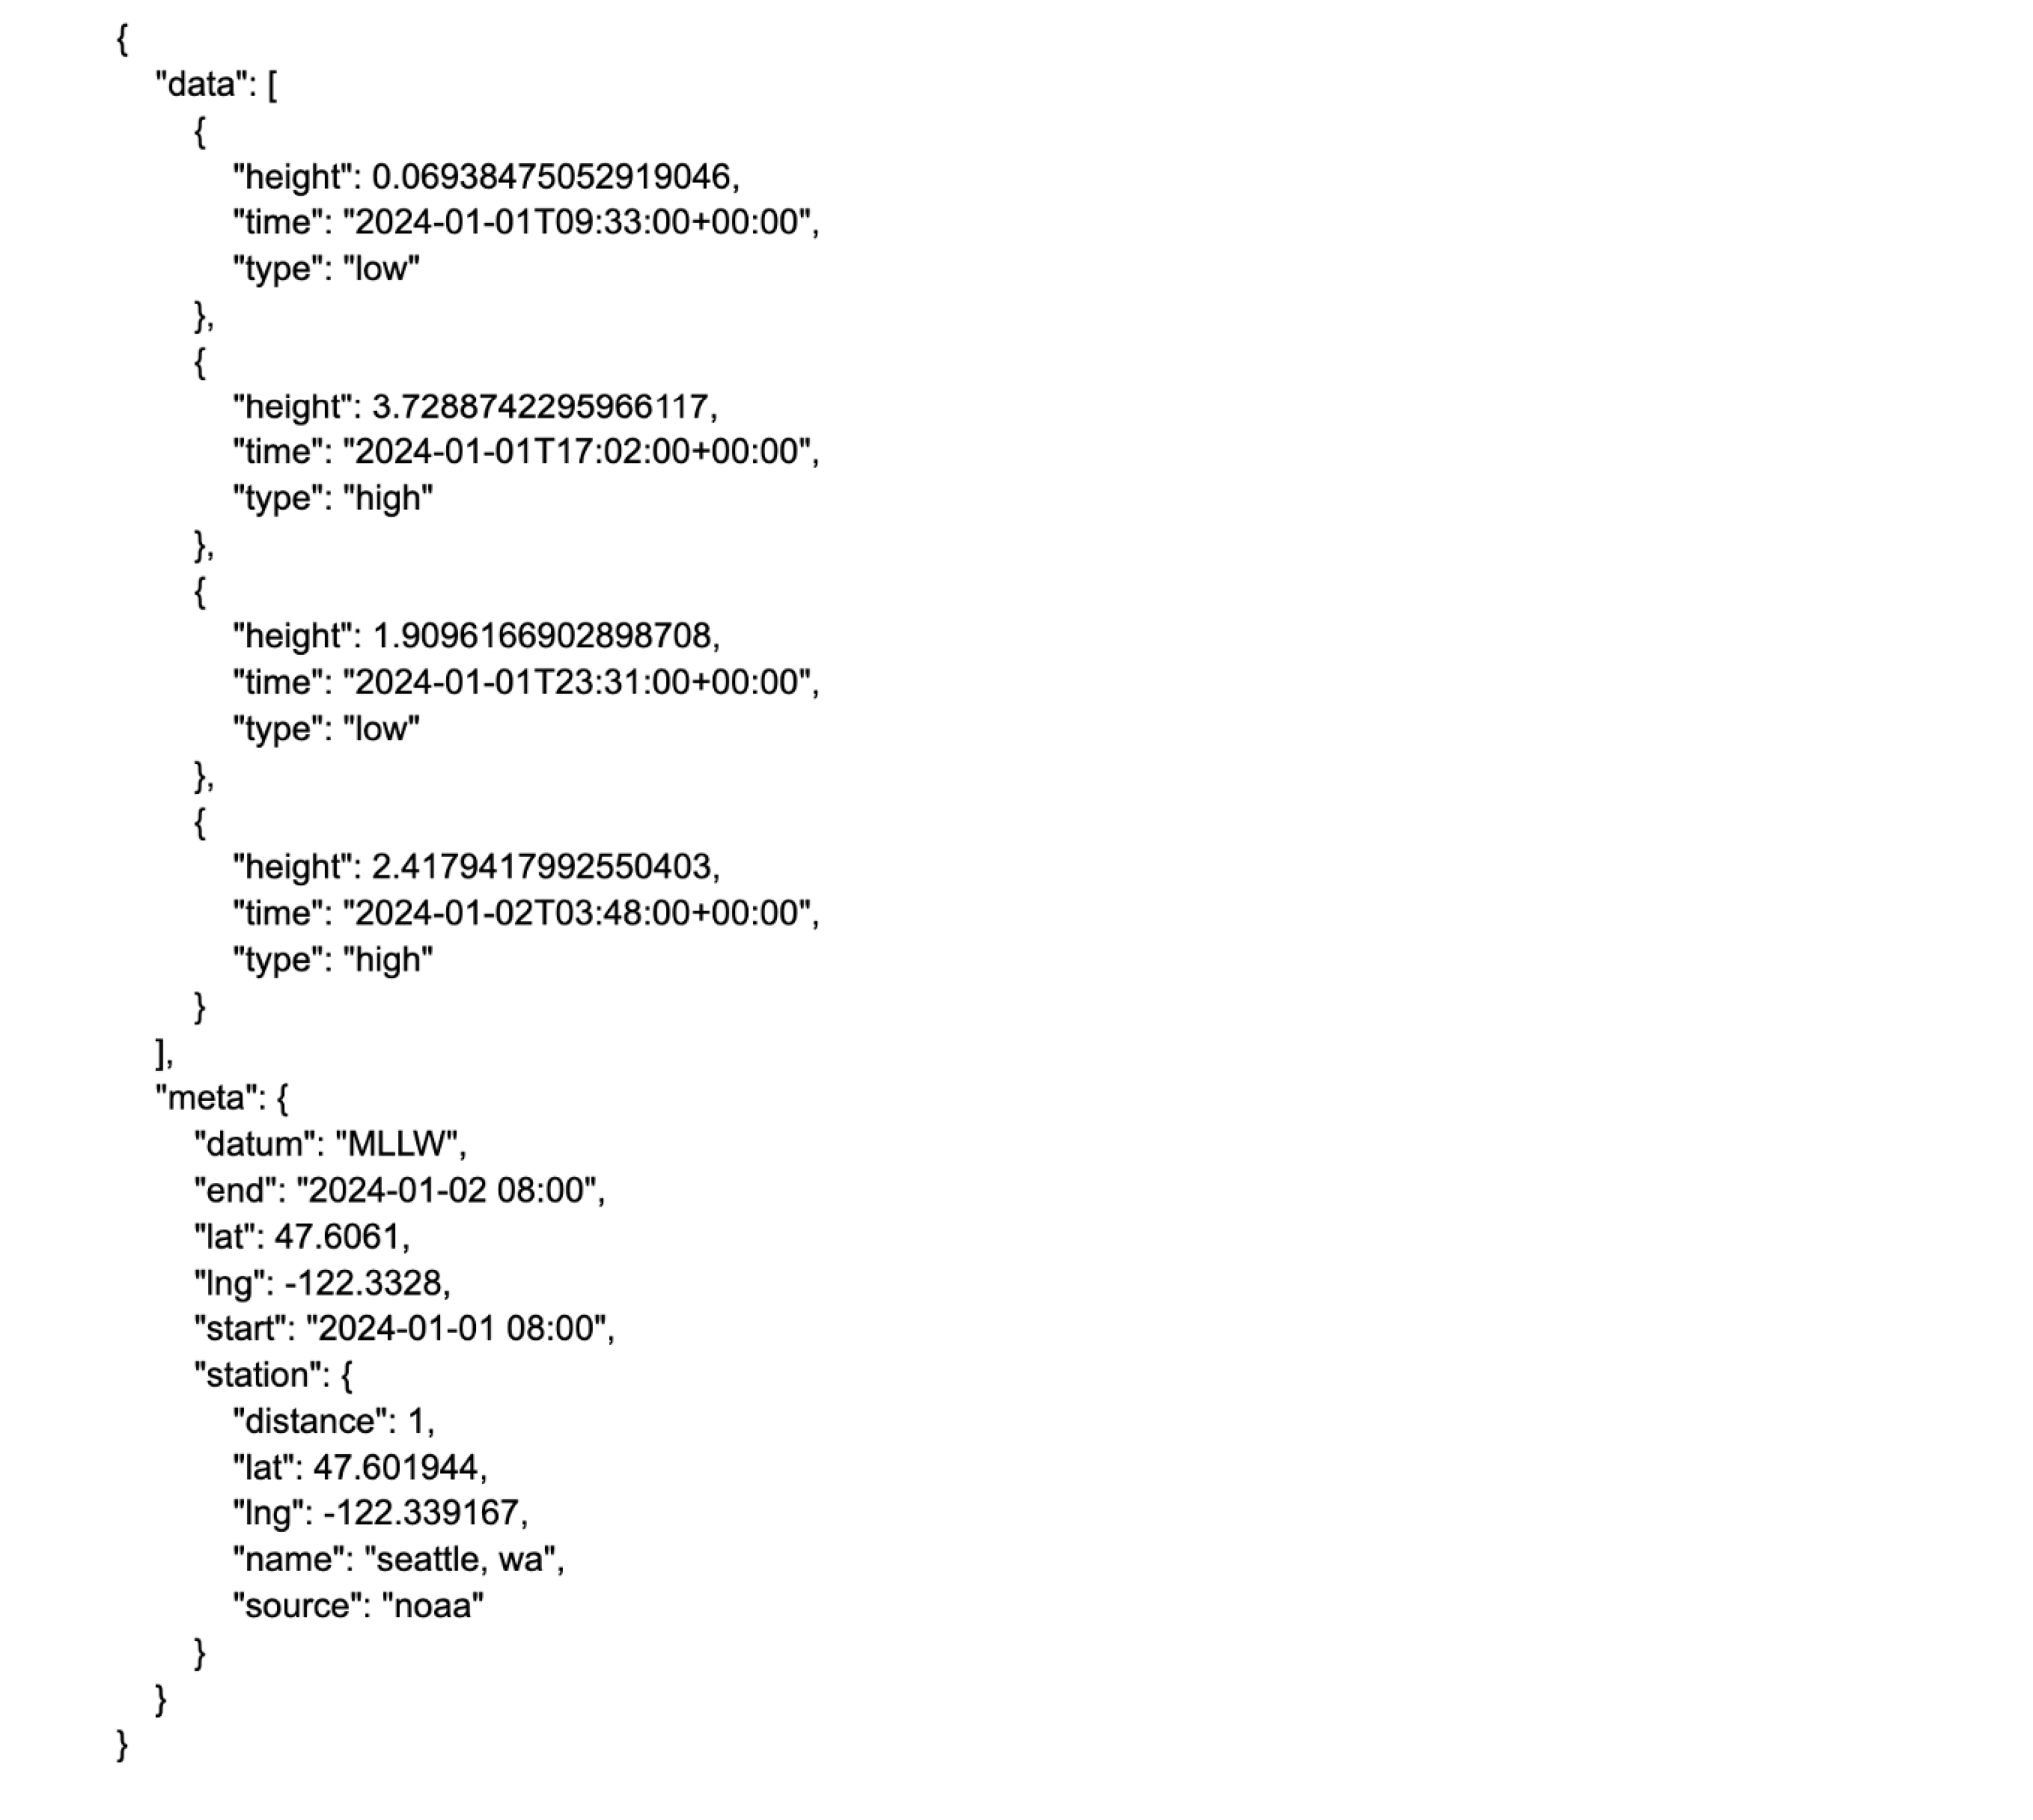
By comparing these two responses with the two graphs created for the MSL and MLLW datums in the previous example, we can clearly see that the extremes match the data produced by the sea-level endpoint. The only difference is that the analysis and the computations have been completely taken care of by the stormglass.io API. As an added bonus, the times at which the tides turn are provided with high precision!
Closing words
We hope that reading this article has been valuable and that it has given you some insight into the tide parts of the stormglass.io API. We will continue to work tirelessly to improve our services and hope to share additional articles on this progress in the near future. Feel free to check out the complete API documentation and don’t hesitate to contact us if you have any questions.
Sign up for our free plan to try us out!
